KB Article #163943
How to monitor Java Memory Usage through JMX
JMX Setup
This document describes how to setup API Server for JMX monitoring. Note that we do not have any specific support for JMX, in the sense that we do not provide specific MBeans to monitor or manage our Gateway.
Therefore, you will only see the default information provided by the JVM (memory, threads, etc.).
To enable JMX (non-secure):
1. Create a jvm.xml file inside api_server_install_dir/groups/group-id/instance-id/conf
NOTE: where group-id and instance-id pertains to the api server in a particular group that requires monitoring.
Paste lines below inside the file and modify IP and port if applicable.
<ConfigurationFragment>
<VMArg name="-Dcom.sun.management.jmxremote"/>
<VMArg name="-Dcom.sun.management.jmxremote.rmi.port=17091"/>
<VMArg name="-Dcom.sun.management.jmxremote.port=8887"/>
<VMArg name="-Dcom.sun.management.jmxremote.authenticate=false"/>
<VMArg name="-Dcom.sun.management.jmxremote.ssl=false"/>
<VMArg name="-Djava.rmi.server.hostname=192.168.0.151"/>
</ConfigurationFragment>
2. Restart the API Server. Check port 8887 is open on the machine using netstat.
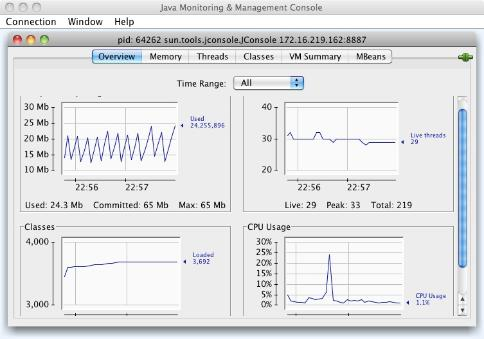
3. Connect to the JVM using JConsole (the full java JDK is required to be installed, we do not ship JConsole with the API Server) like this: jconsole <hostname>:8887
4. A screen similar to below should appear

Attached Files :
- 693.00bytes