KB Article #177624
Collecting Java Memory Dump and Java Stack Trace on Windows Server
1. Summary
2. Download JDK
3. Download SysinternalsSuite
4. Determine the correct PID for each service
5. Collect the dumps
1. Summary
This article explains how to collect Java Memory Dump and Java Stack Trace when SecureTransport is running on Windows Server. It is for Windows Server Only.
Collecting Java Memory Dump and Java Stack Trace on a Windows Server is trickier compared to Unix based OSes due to the use of Cygwin to emulate Windows Services. The PIDs stored in the STServer/var/run/*.PID files are Cygwin Service PIDs, not the Java ones. As a result another method must be used to determine the correct PIDs of the Java processes. Luckily there is a tool shipped with Windows Server to query the Windows Management Instrumentation (WMI) and get the proper PIDs.
Once the correct PIDs are finally determined, there is still the challenge to run the Java tools with correct impersonation of the SYSTEM user. This is due to the fact the Cygwin runs services as SYSTEM, not Administrator. This could be achieved using the "psexec" tool from the Microsoft Sysinternals Suite.
2. Download JDK
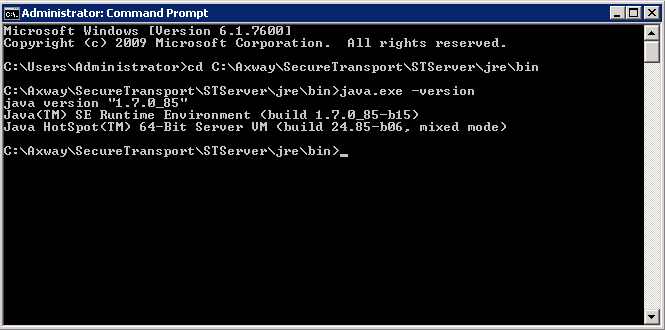
The "jstack" and "jmap" tools are required in order to collect the dumps. Those tools are part of the Java Development Kit (JDK), which has to be downloaded separately. Different SecureTransport versions and service levels use different versions of Java. To determine the correct version, open a CMD window, navigate to the STServer/jre/bin folder and run the following command:
C:> java.exe -version
The Java version would be printed in the CMD window. The same JDK version should be downloaded from the Oracle Website:
http://www.oracle.com/technetwork/java/javase/downloads/java-archive-downloads-javase7-521261.html
Note that SecureTransport 5.1.0 uses 32-bit Java and need the 32-bit JDK version. SecureTransport 5.2.0 and newer use 64-bit Java and need the 64-bit JDK.
3. Download SysInternals Suite
The Sysinternals Suite contains the "psexec" tool required to connect to Java processes as the SYSTEM user instead of Administrator. Only the "psexec" tool would be used, but it is not available as a separate download, so the full suite should be downloaded. The Sysinternals Suite is available from the Microsoft website:
https://technet.microsoft.com/en-us/sysinternals/bb842062.aspx
Once downloaded, the suite should be extracted to easily accessible from CMD folder, for example "C:\SysinternalsSuite".
4. Determine the correct PID for each service
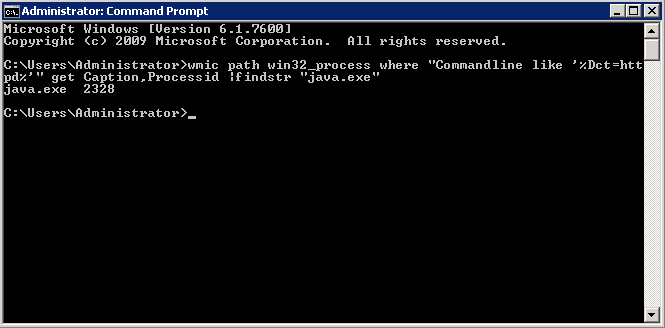
A WMI query should be used to uniquely identify the correct PID for each service. To get the PIDs for different services, the name of the service should be changed in the query. Here are examples for the different services.
HTTPD PID:
c:\> wmic path win32_process where "Commandline like '%Dct=httpd%'" get Caption,Processid |findstr "java.exe"
FTPD PID:
c:\> wmic path win32_process where "Commandline like '%Dct=ftpd%'" get Caption,Processid |findstr "java.exe"
SSHD PID:
c:\> wmic path win32_process where "Commandline like '%Dct=sshd%'" get Caption,Processid |findstr "java.exe"
PeSITD PID:
c:\> wmic path win32_process where "Commandline like '%Dct=pesitd%'" get Caption,Processid |findstr "java.exe"
AS2D PID:
c:\> wmic path win32_process where "Commandline like '%Dct=as2%'" get Caption,Processid |findstr "java.exe"
Transaction Manager (TM) PID:
c:\> wmic path win32_process where "Commandline like '%Dct=tm%'" get Caption,Processid |findstr "java.exe"
5. Collect the dumps
Once the correct PID is determined, the psexec tool should be used to connect to the processes and collect the dumps as the SYSTEM user. For example to collect the Memory dump of HTTP service with PID 2328, the following command should be used. Note that the JDK location might be different based on the version. The dump file location can also be modified:
c:\SysinternalsSuite> PsExec.exe -s "c:\Program Files\Java\jdk1.7.0_79\bin\jmap.exe" -dump:format=b,file=c:\HTTPD_memory_dump.bin 2328
To collect the Stack Trace of the HTTP service with PID 2328, the following command should be used:
c:\SysinternalsSuite> PsExec.exe -s "c:\Program Files\Java\jdk1.7.0_79\bin\jstack.exe" 2328 > c:\HTTP_jstack.out

Both commands should complete with exit code 0. This completes collecting the Java Stack Trace and the Java Memory Dump for the given service.